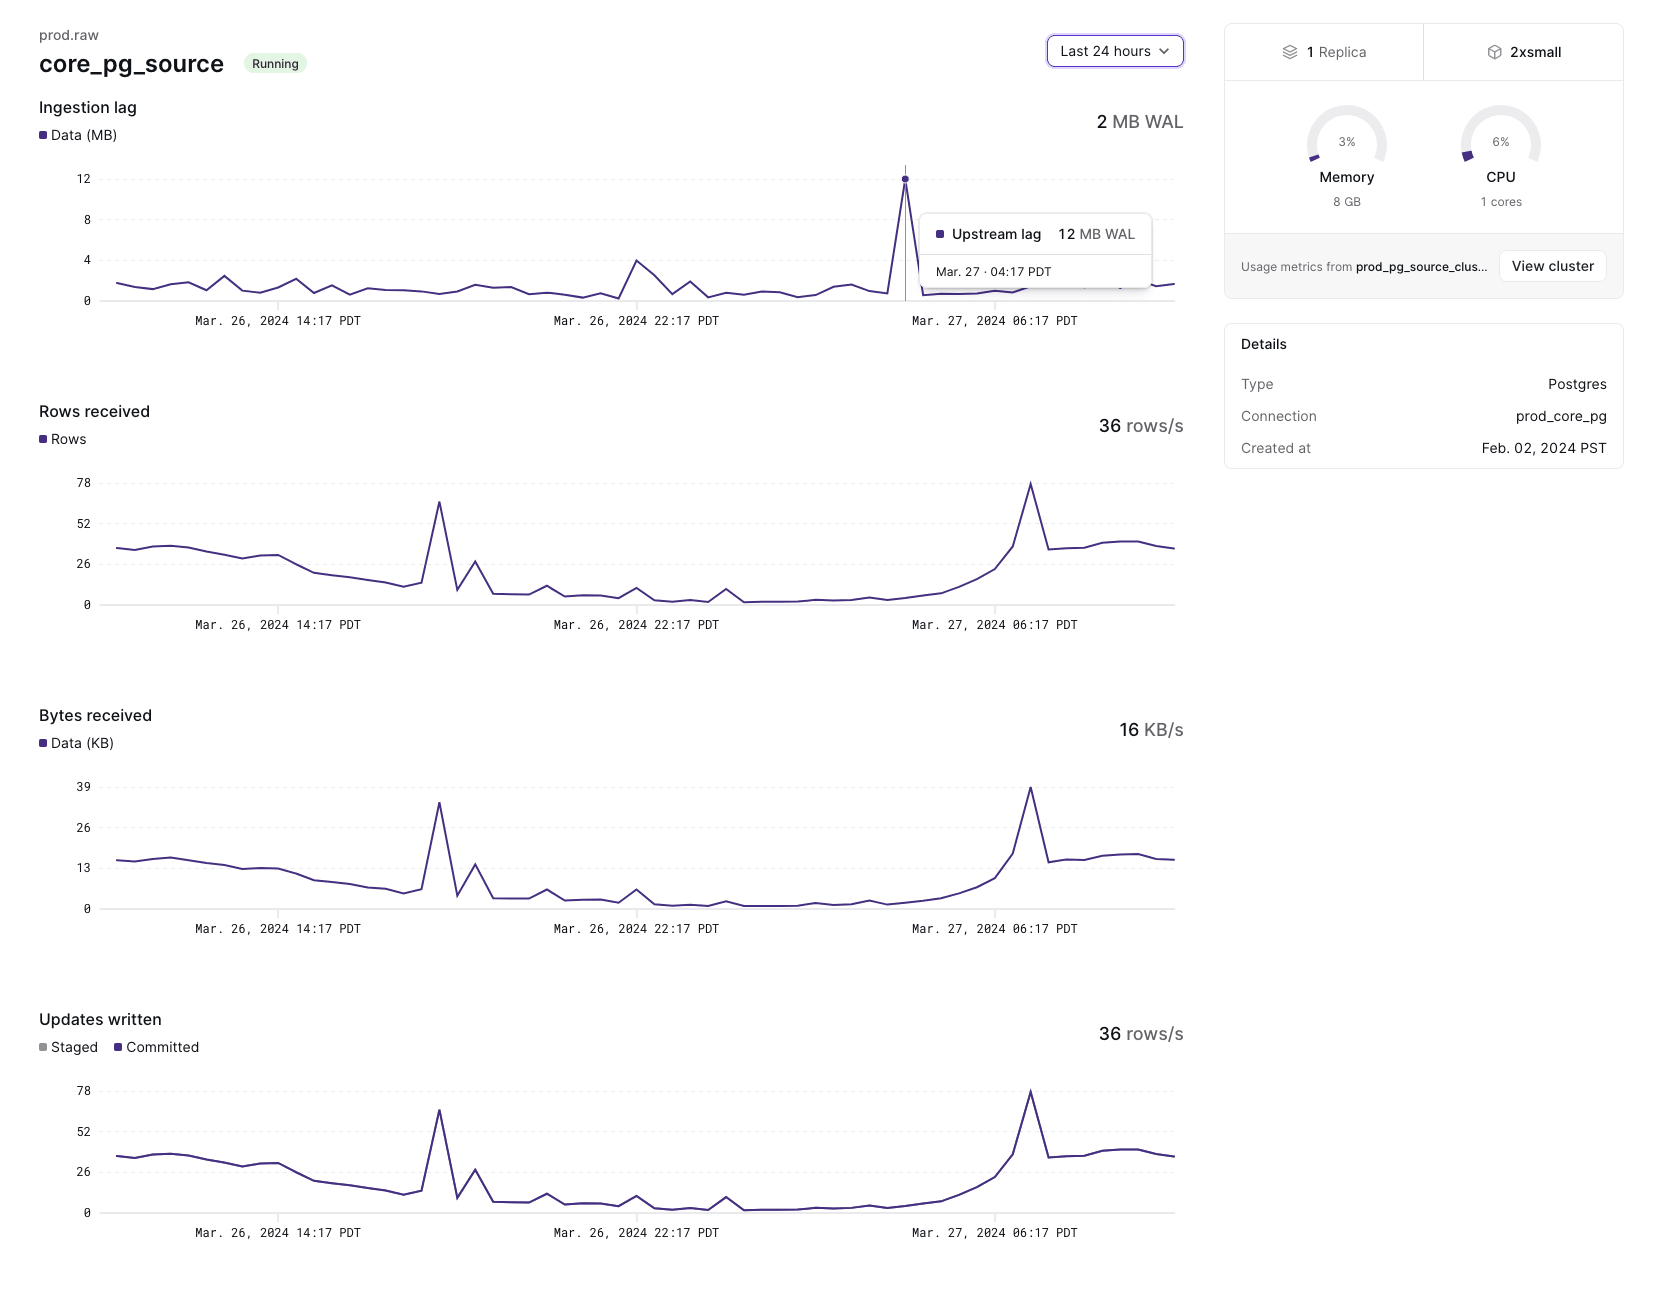
We’ve made it easier to keep a pulse on the health of your sources right in the
web console: instead of running lengthy introspection queries by hand, you can
now monitor ingestion progress (or lack thereof) and cluster resource
utilization using the new Overview page in the Sources navigation tab.

We’ll extend this overview with more details in the near future, like snapshot progress metrics, so you never miss a bit (ha!). If you have any feedback, or requests for new useful metrics, we’d love to hear about it!