If you’re using blue/green deployments to manage schema changes in Materialize, you’ve likely felt the frustration of seeing your cluster metrics get blown away every time you cut over to a newly minted environment. Rightfully so! This gets in the way of understanding how the health of your clusters is evolving over time. 🤕
To address this, we’ve improved how clusters that undergo blue/green deployments are displayed in the Materialize Console: you now get access to cluster utilization and health metrics across deployments! Let’s look at an example:
During a blue/green deployment
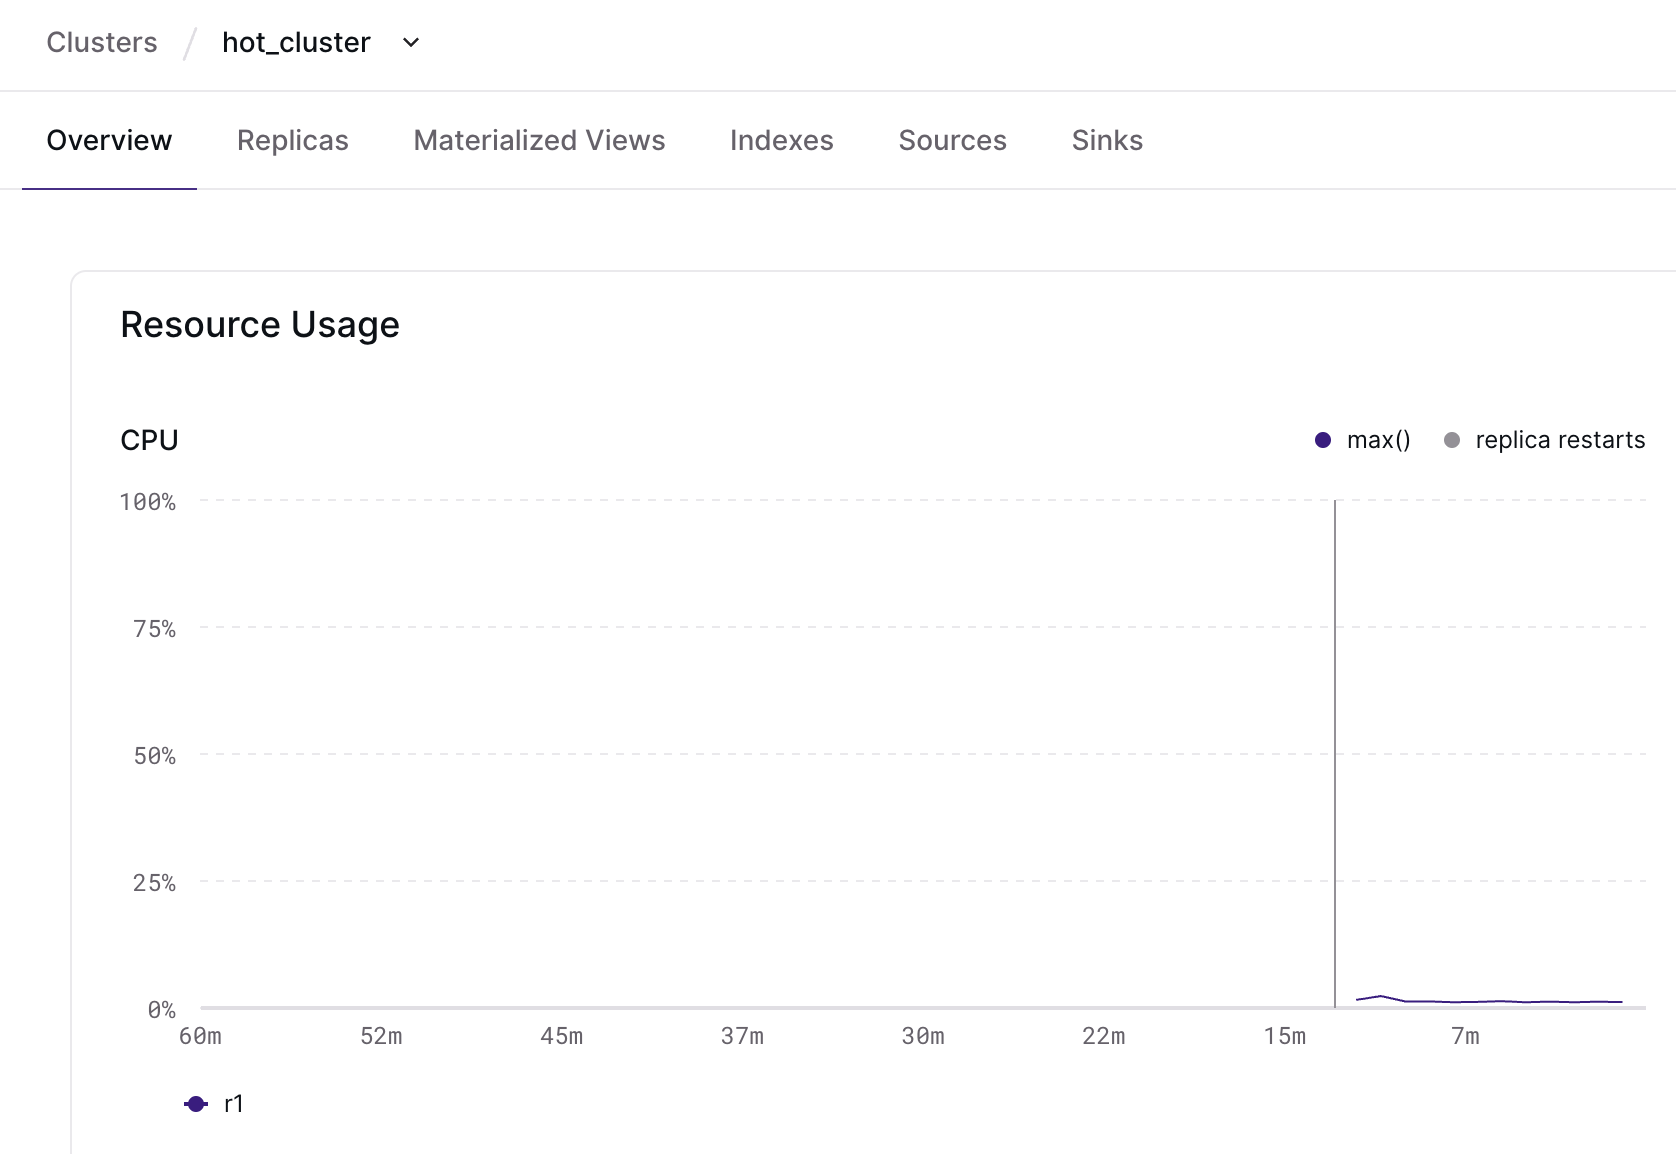
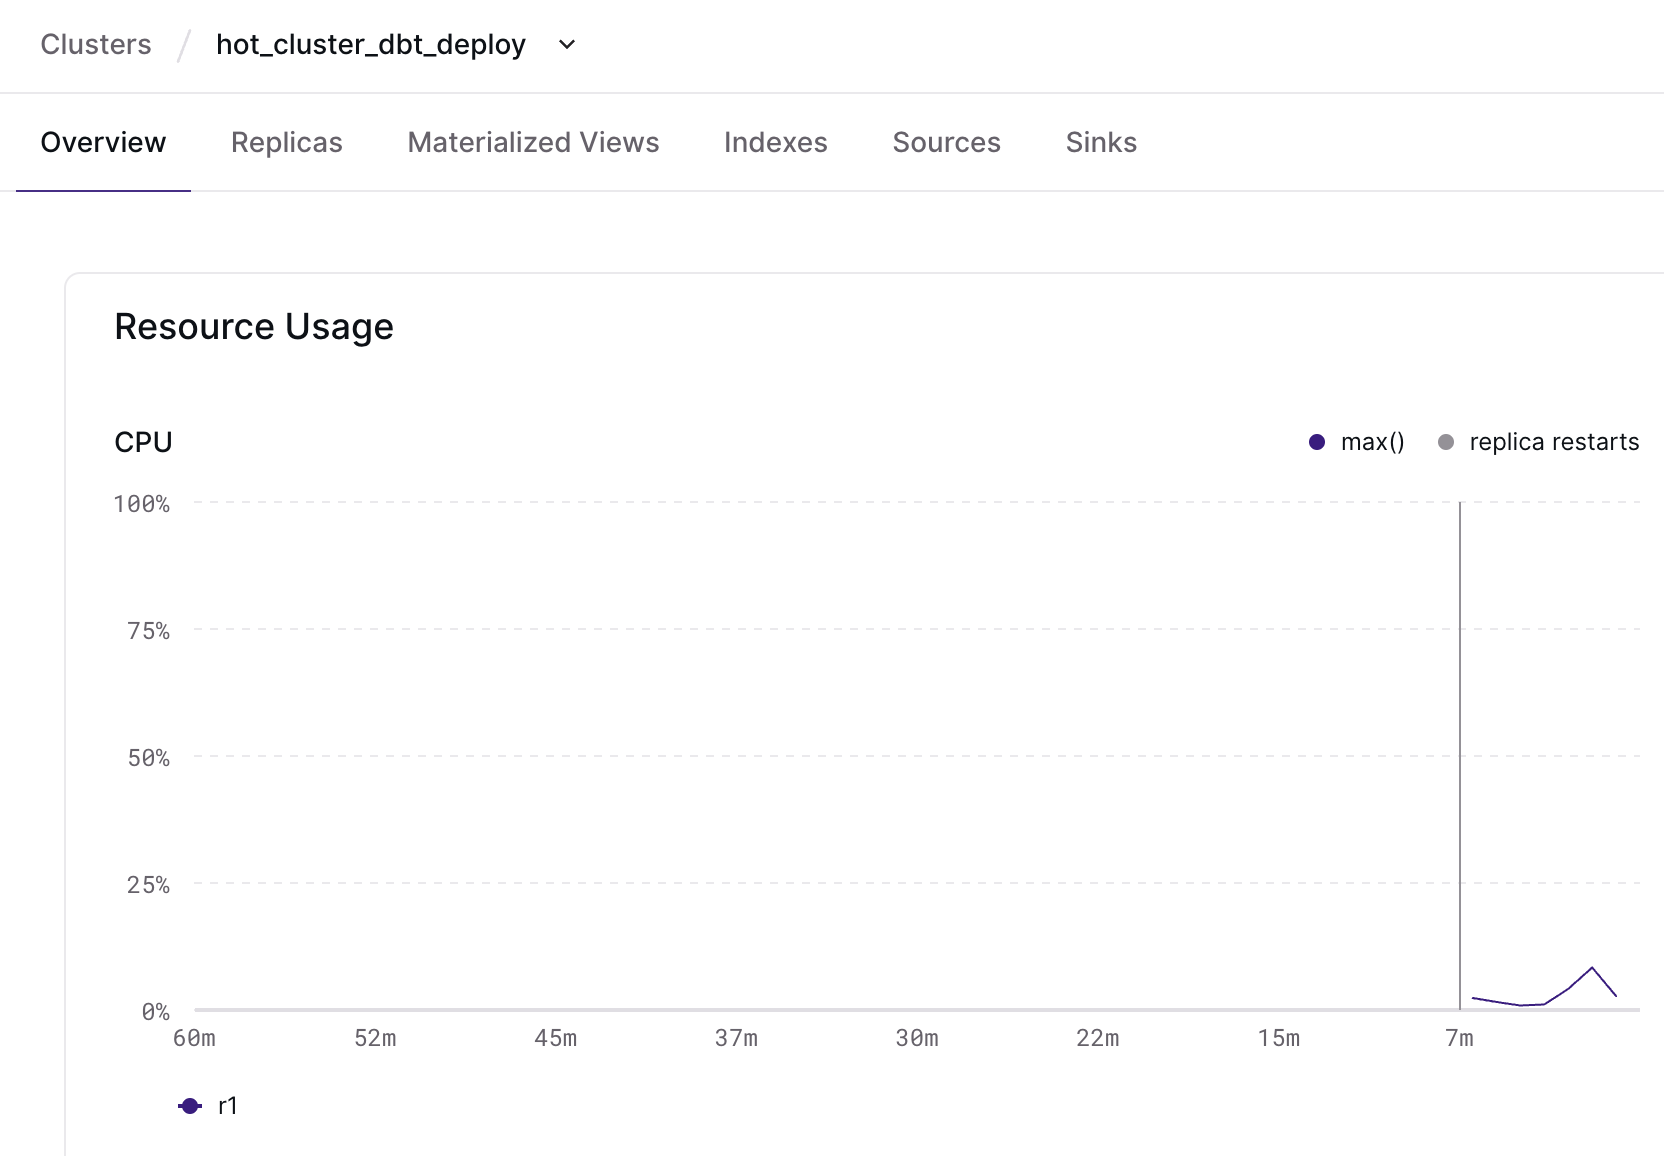
While hot_cluster is busy doing cluster work, a new hot_cluster_dbt_deploy
cluster is hydrating with your changes. You can monitor each cluster in its
individual overview page and take your time validating the deployment.


After a blue/green deployment
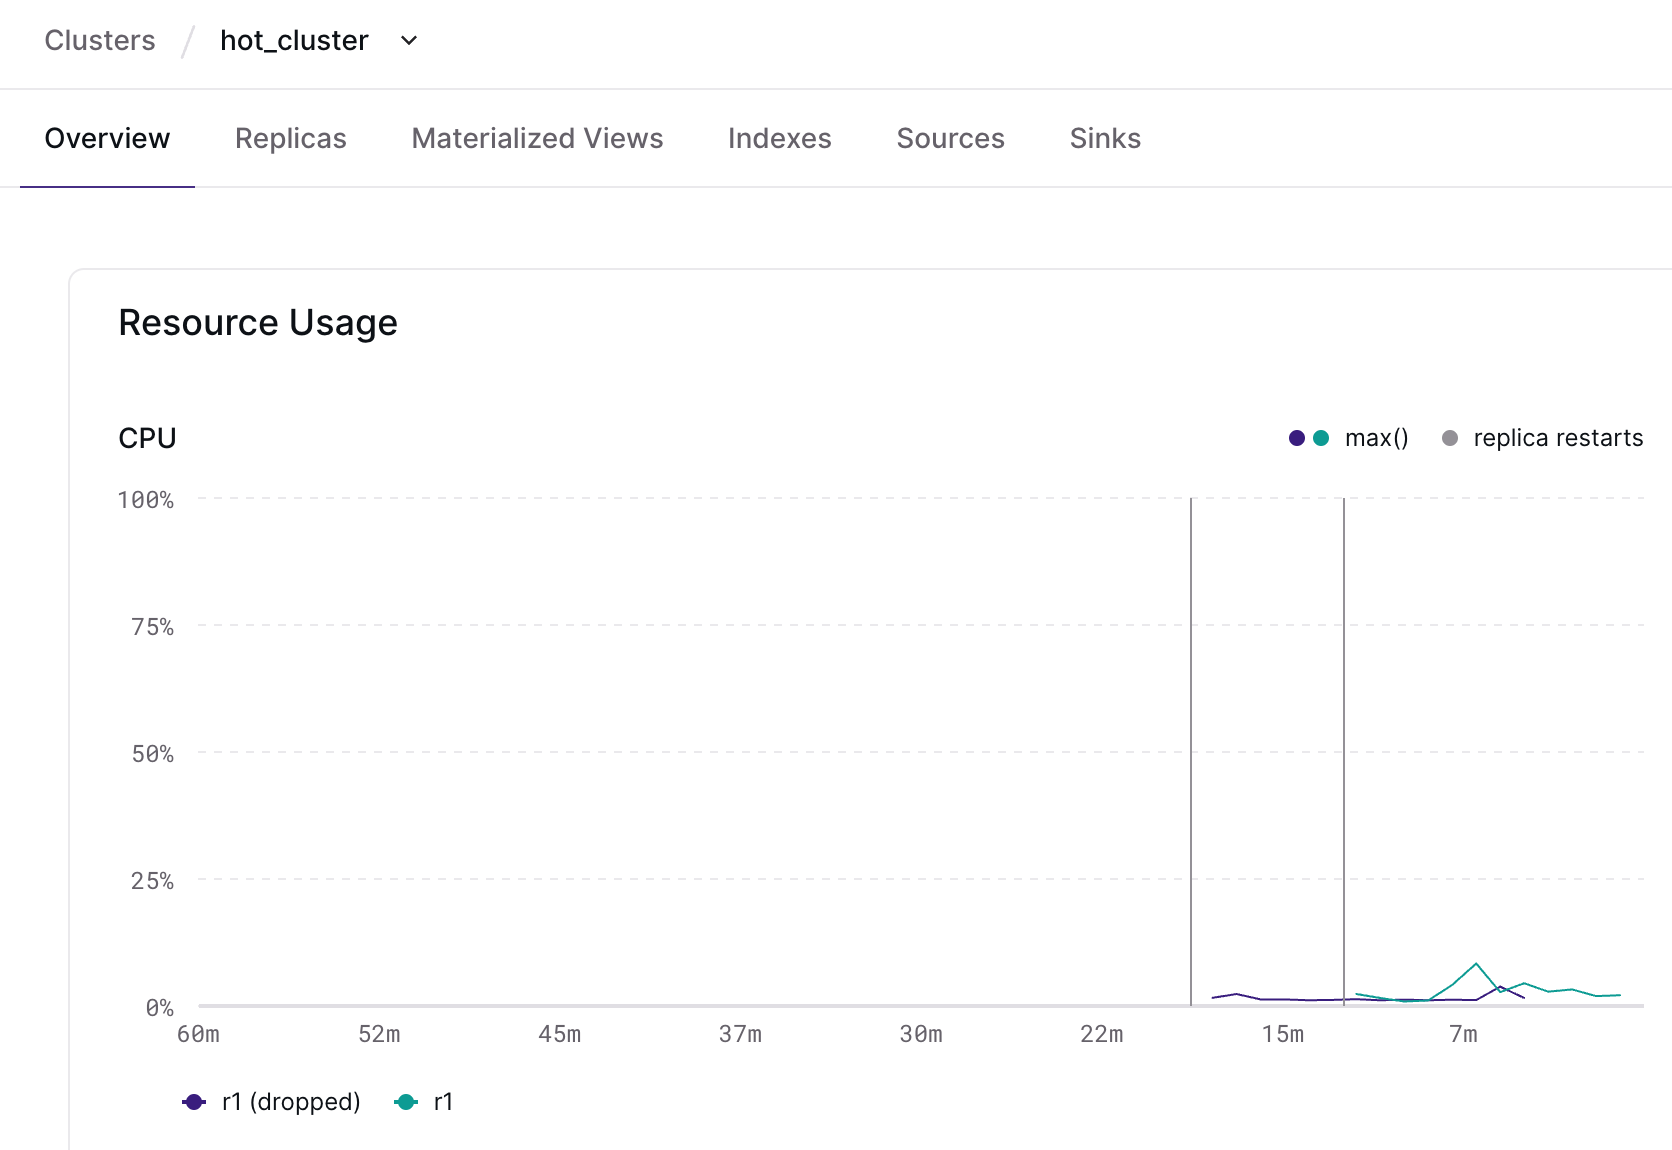
Once you’re confident in the deployed changes, you can swap the clusters to push
them live! Now, the cluster overview page will retain the metrics of the
pre-deployment cluster, rather than just showing you the metrics for the
post-deployment hot_cluster (née hot_cluster_dbt_deploy).

important
Note: If you’re rolling out your own observability, the system catalog table
to look at for pre- and post-deployment cluster mapping is
mz_cluster_deployment_lineage.
With this improvement, you can more easily keep a pulse on the health of your environment as you evolve it, as well as identify any regressions after applying schema changes to your data model!